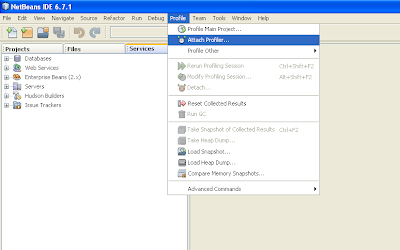
I just used Netbeans profiler for profiling a java based application which was getting hanged while using it. I was really impressed with the simplicity and elegance of the profiler. Using the profiler is a child's play and it gives you the required info in a nice GUI with charts and graphs which helps you in finding out where the problem lies. You can also view the live profiling results. Lets see how simple it is to profile an application using Netbeans profiler. I am using Netbeans 6.7.1.
1. Initially open your project in Netbeans. Now go to Profile menu and select Attach Profiler sub-menu
2. A new dailog for Attach Profiler opens up. Select the project name (jtharness in my case) from the drop down list corresponding to Attach to label.
3. At the bottom of this dialog you can see following "Attach Mode: Local direct attach to Java Application, change". Click on change. A new Attach Wizard pops up. In this select the appropriate Target type, Attach method and Attach invocation and press Next button
4. In the next page review your Attach Settings and press Next
5. Now the Mannual Integration page opens up. Copy the startup option shown in Step 1 and use this option in CLI for java command while starting your appliccation.
6. Now as I had mentioned above use the option given in Step 1 for starting your application so as to integrate the profiler. For eg: normally I start my application using the CLI command
java -jar javatest.jar
I will replace this call with following
java -agentpath:"D:\Program Files\NetBeans 6.7.1\profiler3\lib\deployed\jdk15\windows\profilerinterface.dll=\"D:\Program Files\NetBeans 6.7.1\profiler3\lib\"",5140 -jar javatest.jar
7. Now click Finish button. The original Attach Profiler dialog comes up, click on the Attach Button and your profiler starts up!!


5 Responses to "Profiling using Netbeans profiler":
What a great resource!
Hi,
Thanks for the great article.
After doing the 6th part and clicking "attach profiler", netbeans send an error "Calibration data missing".
SO i follow their recommandation saying that you need to do "Profile > Advanced Commands > Run Profiler calibration" then the calibration is succesful but it keep telling me this error when i try to attach the profiler.
Do you run into this kind of error or do you have any idea of what i could have done wrong?
Thx.
@P!co
No I didn't got any such error
Unfortunately I have checked the box "always reboot the remote device when detaching profiler". Now i cannot undo it, everytime my device has to reboot when i detach the profiler. I am not able to reproduce some scenario because of this.
Peculiar article, totally what I needed.
Here is my site Arthur Falcone
Post a Comment